Published: 2 September, 2026
- Share
-

-

-

Ready to take your sales and executives teams out of Excel sheets and provide your team with up-to-date forecasting and activity reports? Great! If your RMs and sales reps are using HubSpot, you've got a LOT of reporting options at your fingertips.
Here are some of the common dashboards and reports requested by our financial services clients.
Executive Reports: Revenue, Line of Business, YoY Comparisons
Your Executive team wants to to know the big-picture KPIs. How many deals are we closing? What is our managed funds total? Are we on pace to hit our Quarterly & Annual Goals? Where is our revenue coming from?
Total Business Opportunity (Deals Created) vs Won Business vs Lost Business
This can also include YoY comparisons or be broken down by Quarter.

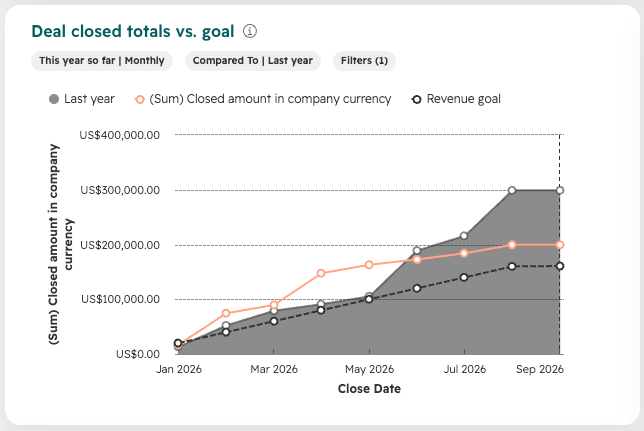
Revenue Year over Year & vs Revenue Goals
Are you on pace to hit your goals? How do sales compare to last year?
Sales Manager Dashboards & Reports
As a Sales Manager it's important to know how your team is doing so you can reward those doing well and identify coaching opportunities for those who need more support. Some reports we commonly see on Sales Manager Dashboards for finance include:
- Rep activity reports
- Deal creation and close rates
- Revenue opportunities vs closed won revenue
- Reports by product line, location, or team
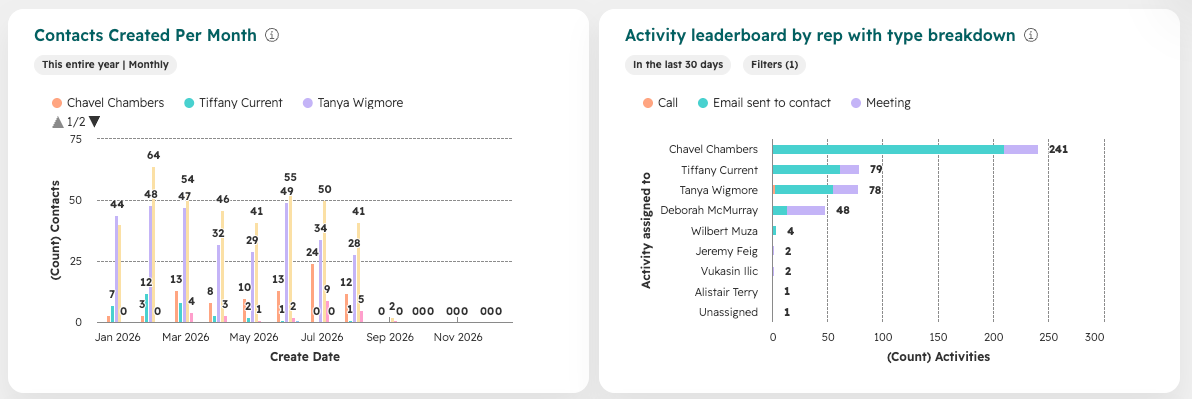
Rep & RM Activity Reports
Who is creating new leads, reaching out to contacts and creating deals?

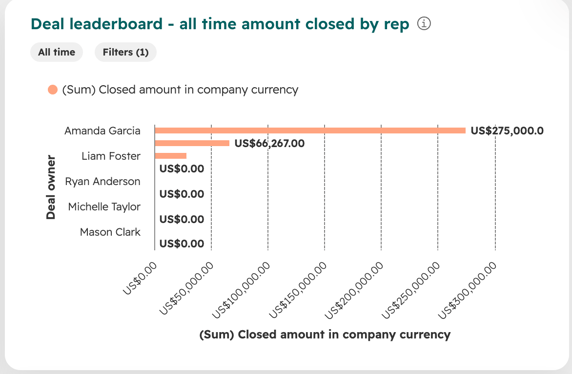
Won Deals
Which reps are closing deals, and how much revenue have they generated?
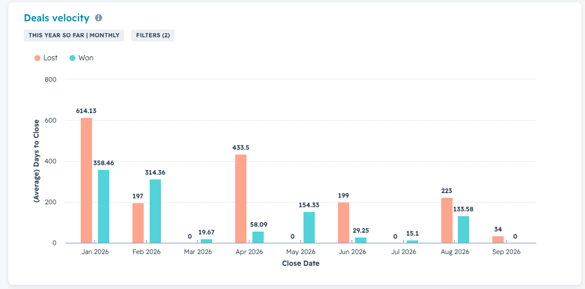
Deals Velocity
How long are deals taking to close? These can also be broken down by rep to identify who is quick to close and who is not.
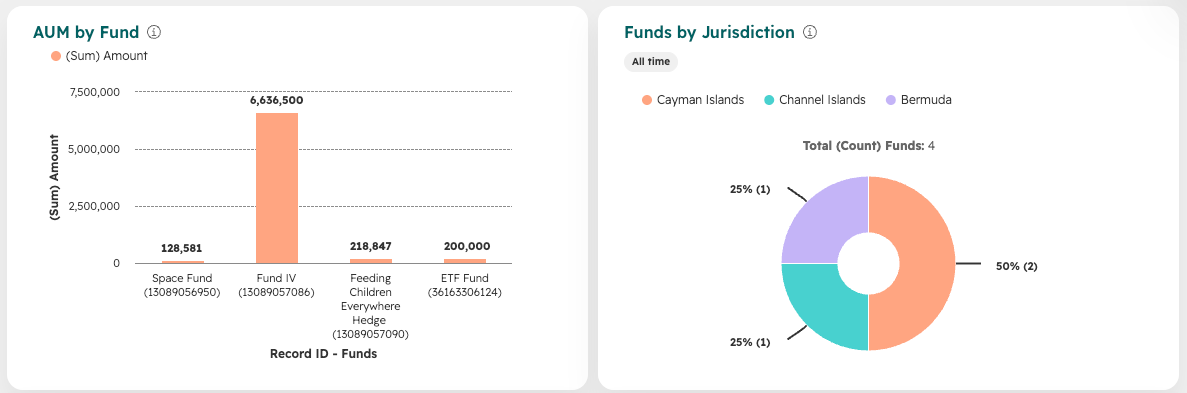
Product Performance
Funds, AUM, Product, Jurisdiction, etc.. This can be per product or product line, per team or pipeline, or segmented numerous other ways.
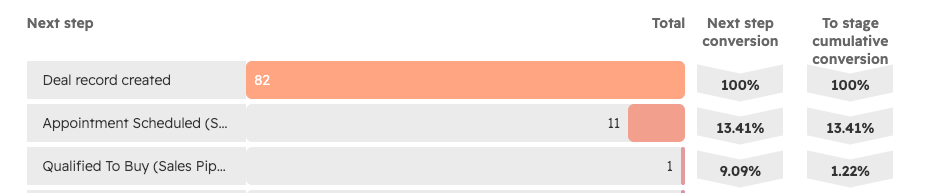
Pipeline Conversion Rates
Where are deals getting stuck, dropping off, and what is your overall deal conversion rate?
These are just some examples of common HubSpot Dashboard reports for financial services. We have loads of custom reports that we haven't shared - but would love to review with you in person. If you're looking for better pipeline and revenue reporting, please contact us.

Other posts you may be interested in

Tracking MQLs & SQLs in HubSpot: Our Top Report Recommendations

Why Industry-Specific CRM Expertise Matters: CRO:NYX Digital Earns HubSpot Banking Industry Specialist Designation

How a Multi-National Company Took Month-End Invoicing Off the Calendar

.png)
.png)
.png)